
The global battery industry is experiencing unprecedented growth, driven by the accelerating adoption of electric vehicles (EVs) and grid-scale energy storage. According to the International Energy Agency (IEA), global power battery capacity is projected to exceed 4.5 TWh by 2030—up from just 0.5 TWh in 2020. However, this expansion is accompanied by pressing challenges for manufacturers: inconsistent production yields (often varying by 5-15% across facilities), soaring equipment investment costs (accounting for 40-60% of total factory capex), and the need to adapt to emerging technologies like solid-state batteries (SSBs).
At the heart of these challenges lies the battery production equipment line—a complex integration of machinery, software, and process expertise that dictates everything from product quality to operational efficiency. This guide goes beyond surface-level overviews to deliver actionable technical insights and strategic frameworks, helping manufacturers navigate the full lifecycle of battery equipment: from initial planning and equipment selection to operational optimization and future-proofing for next-generation technologies.
Chapter 1: Laying the Foundation—Understanding the Anatomy of Battery Production Equipment Lines
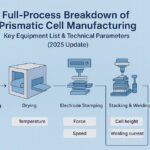
To make informed decisions about equipment, manufacturers must first grasp how individual machines interact across the battery production workflow. Battery manufacturing is a highly sequential process, with each stage relying on the precision of the prior one. Below is a technical breakdown of core stages, equipment functions, and critical performance metrics.
1.1 The Four Core Stages of Battery Production & Key Equipment
Battery production can be divided into four interconnected phases, each with unique equipment requirements. For lithium-ion batteries (LiBs)—the dominant technology today—this workflow is well-established, but SSBs are reshaping equipment needs (addressed in Chapter 4).
| Production Stage | Key Equipment | Core Function | Critical Technical Requirements |
|---|---|---|---|
| Electrode Preparation | High-shear mixers, slot-die/knife coaters, roll presses, slitting machines | Convert raw materials (cathode/anode powders, binders, solvents) into uniform, thin electrodes | – Mixers: Shear rate ≥ 10,000 s⁻¹ to ensure particle dispersion; < 5% solid content variation – Coaters: Thickness tolerance ±1 μm; web speed ≥ 80 m/min (EV batteries) – Roll presses: Pressure control ±5 kN; electrode density variation < 2% |
| Cell Assembly | Winding/stacking machines, tab welding systems, electrolyte injection machines, cell casing equipment | Assemble electrodes into cells and seal them | – Winders: Alignment accuracy ≤ ±5 μm; cycle time ≤ 0.5 s/cell (high-volume lines) – Welding systems: Laser power stability ±2%; joint resistance < 5 mΩ – Injection machines: Vacuum level ≤ -95 kPa; injection volume precision ±1% |
| Activation & Testing | Formation chambers, grading systems, impedance testers | Charge/discharge cells to activate electrochemistry; sort by performance | – Formation chambers: Temperature control ±0.5°C; voltage monitoring resolution 0.1 mV – Grading systems: Capacity sorting accuracy ±1% of rated capacity |
| Packaging & Final Inspection | Thermal management integration machines, AOI (Automated Optical Inspection) systems, leak testers | Assemble cells into packs; verify quality | – AOI systems: Defect detection rate ≥ 99.5% (e.g., electrode cracks, foreign particles) – Leak testers: Sensitivity ≤ 1×10⁻⁶ Pa·m³/s |
Case Example: CATL’s 21GWh EV battery line in Ningde uses a combination of domestic slot-die coaters (from Wuxi Lead) and imported laser welding systems (from Trumpf). This hybrid setup balances precision (welding resistance < 3 mΩ) and cost, achieving a stable electrode thickness tolerance of ±0.8 μm and a cell yield of 98.2%.
1.2 Equipment Adaptation for Different Battery Chemistries
Not all batteries require the same equipment. The choice of chemistry—e.g., lithium iron phosphate (LFP) vs. nickel-cobalt-manganese (NCM) for LiBs, or sulfide vs. oxide electrolytes for SSBs—directly impacts equipment design.
- LFP vs. NCM Batteries: LFP electrodes are thicker (50-80 μm) and more brittle, requiring roll presses with gentler pressure ramps (5-10 kN/s) to avoid cracking. NCM electrodes, by contrast, demand higher coating precision (±0.5 μm) due to their higher energy density sensitivity.
- Solid-State vs. Liquid-State Batteries: SSBs eliminate liquid electrolytes, rendering injection machines obsolete. Instead, they require dry electrode coaters (to process binder-free electrode materials) and isostatic presses (to achieve uniform cell density under 100-200 MPa pressure). For example, QuantumScape’s SSB pilot line uses a custom dry coater from Hohsen Corp. that processes sulfur-based cathodes at 120°C, with a material utilization rate of 99.1%.
1.3 Foundational Planning for New Production Lines
Before purchasing equipment, manufacturers must align line design with产能 (GWh target), chemistry, and long-term scalability. Key considerations include:
- Capacity Matching: A 10GWh annual capacity line requires coaters with a web speed of ≥ 100 m/min, winders operating at 600 cells/hour, and formation chambers with 5,000+ stations. Mismatched equipment (e.g., a high-speed coater paired with a slow winder) leads to bottlenecks and 15-20% lower effective capacity.
- Cleanroom Requirements: Electrode preparation and cell assembly demand ISO Class 7 cleanrooms (≤ 352,000 particles/m³ of ≥0.5 μm size) to prevent contamination. For SSBs, this tightens to ISO Class 6 (≤ 35,200 particles/m³) due to the sensitivity of solid electrolytes to moisture.
- Utility Integration: Equipment consumes 30-40% of a battery factory’s total energy. A 10GWh line requires 15-20 MW of power and 5,000 m³/h of deionized water—planning for on-site solar or heat recovery systems can reduce energy costs by 25-30%.
Chapter 2: Making Informed Decisions—Strategic Equipment Selection
Equipment selection is not just about “buying the best”—it’s about balancing performance, cost, and alignment with business goals (e.g., short-term cost savings vs. long-term scalability). Below is a framework for navigating key decisions.
2.1 Domestic vs. Imported Equipment: A Data-Driven Comparison
The debate between domestic (e.g., Chinese, Korean) and imported (e.g., Japanese, German) equipment hinges on three factors: technical performance, total cost of ownership (TCO), and service support.
| Factor | Domestic Equipment (e.g., Wuxi Lead, Hanwha) | Imported Equipment (e.g., Kobe Steel, Manz) |
|---|---|---|
| Technical Performance | – High precision for mature processes (e.g., LiB coaters with ±1 μm tolerance) – Limited expertise in cutting-edge tech (e.g., SSB dry coaters) | – Superior precision for advanced applications (e.g., SSB isostatic presses with ±2 MPa pressure control) – Proven reliability in high-volume lines (MTBF ≥ 8,000 hours) |
| Total Cost of Ownership (TCO) | – Purchase cost: 40-60% lower than imports – Maintenance cost: 30-50% lower (local spare parts) – Energy efficiency: 5-10% lower than imports (due to older motor tech) | – Purchase cost: Higher upfront (e.g., $2M vs. $1M for a coater) – Maintenance cost: Higher (imported spare parts, 2-4 week lead times) – Energy efficiency: 5-10% higher (e.g., variable-frequency drives) |
| Service Support | – Fast response time (24-48 hours for on-site support) – Customization flexibility (e.g., adapting coaters for LFP electrodes) | – Longer warranty periods (2-3 years vs. 1-2 for domestic) – Global service networks (critical for overseas factories) |
Strategic Recommendation: For mature LiB production (e.g., LFP for energy storage), domestic equipment offers the best TCO—e.g., BYD’s 30GWh LFP line uses 100% domestic equipment, achieving a TCO 35% lower than a comparable imported line. For advanced SSB or high-end NCM lines, a hybrid approach (imported core equipment + domestic auxiliary machines) balances precision and cost—Panasonic’s Osaka SSB pilot line uses imported dry coaters (Kobe Steel) paired with domestic Japanese winding machines (Fujikura), cutting TCO by 20%.
2.2 Turnkey Lines vs. Individual Equipment: Which Fits Your Business?
Manufacturers face a choice: purchasing a turnkey line (single vendor provides all equipment and integration) or individual equipment (sourcing machines from multiple vendors).
- Turnkey Lines: Ideal for large-scale manufacturers (≥5GWh capacity) seeking speed and compatibility. Wuxi Lead’s turnkey lines, for example, integrate mixing, coating, and winding equipment with pre-tested software, reducing commissioning time from 6 months to 2-3 months. The result: 30% higher equipment compatibility and 15-20% faster time-to-market. However, turnkey lines offer less flexibility—customizing a line for SSBs mid-project can add 20-30% to costs.
- Individual Equipment: Better for SMEs (≤2GWh capacity) or manufacturers testing new chemistries. Sourcing core machines (e.g., a Trumpf laser welder) and auxiliary equipment (e.g., a domestic slitter) allows for targeted investment. For example, a Chinese SME producing specialty Li-ion batteries for drones saved 40% on upfront costs by purchasing individual equipment, though commissioning took 4 months longer than a turnkey line.
ROI Analysis: A 10GWh turnkey line costs $300-400M with a payback period of 3-4 years. An individual equipment line for the same capacity costs $250-350M but has a longer payback (4-5 years) due to commissioning delays and compatibility risks.
2.3 Overseas Factory Equipment Planning: Navigating Compliance & Supply Chains
As battery manufacturers expand globally (e.g., CATL in Germany, LG Energy Solution in the U.S.), equipment planning must account for regional regulations and supply chain constraints.
- Regulatory Compliance: EU markets require equipment to meet CE certification (e.g., EN 61558 for electrical safety) and REACH (Restriction of Hazardous Substances) standards—imported machines must use lead-free solders and low-VOC (volatile organic compound) coatings. In the U.S., the Inflation Reduction Act (IRA) incentivizes domestic equipment use (30% tax credit for lines with ≥50% U.S.-sourced components).
- Supply Chain Resilience: Overseas factories should prioritize vendors with local spare parts warehouses. For example, LG Energy Solution’s Michigan factory uses Hanwha equipment (Korean vendor) with a U.S.-based spare parts center, reducing maintenance downtime from 72 hours to 24 hours.
- Patent Risks: Avoid equipment that infringes on regional patents—e.g., in Europe, certain slot-die coating designs are patented by Bosch, so manufacturers may need to source from licensed vendors like Manz.
Chapter 3: Optimizing Operations—Solving Pain Points to Boost Efficiency
Even the best equipment underperforms without proper operation and maintenance. This chapter addresses common operational pain points and provides technical solutions.
3.1 Troubleshooting Core Process Defects
Defects like uneven coating or poor welds are costly—they can reduce yields by 5-10% and increase scrap rates. Below are root causes and solutions for top defects:
- Uneven Electrode Coating: Caused by inconsistent slurry viscosity or coater roller misalignment. Solution: Install a real-time viscosity sensor (monitoring range 100-10,000 cP) to adjust mixer speed dynamically, and use laser alignment tools to calibrate coater rollers (tolerance ±0.1 mm). For example, a Chinese battery maker reduced coating unevenness from 8% to 2% by adding these tools, boosting yield by 6%.
- Tab Welding Defects (Cold Joints): Caused by unstable laser power or poor electrode positioning. Solution: Implement a closed-loop laser power control system (feedback frequency ≥ 1 kHz) and vision-guided positioning (accuracy ±0.5 mm). Samsung SDI’s Hungary factory uses this setup, cutting cold joint rates from 0.8% to 0.1%.
- Electrolyte Infiltration Issues: Caused by insufficient vacuum or short infiltration time. Solution: Increase vacuum level to -98 kPa and extend infiltration time from 2 hours to 4 hours (for thick LFP electrodes). CATL’s Qinghai factory saw a 40% reduction in high-internal-resistance cells after this adjustment.
3.2 Predictive Maintenance: Reducing Downtime with IoT
Unplanned downtime costs manufacturers $50,000-$100,000 per hour. Predictive maintenance (PdM) uses IoT sensors and AI to detect equipment issues before they cause failures.
- Sensor Selection: Install vibration sensors (monitoring range 0.1-100 Hz) on roll press bearings, temperature sensors (±0.1°C accuracy) on coater drying zones, and current sensors (±1% accuracy) on welding power supplies.
- Data Analytics: Use machine learning algorithms to analyze sensor data—e.g., a 20% increase in roll press vibration may indicate bearing wear, triggering a maintenance alert 2 weeks before failure. Wuxi Lead’s IoT platform, for example, reduces unplanned downtime by 35% for its coaters.
- Cost Savings: A 10GWh line using PdM saves $1-2M annually in maintenance costs and avoids $5-10M in lost production from downtime.
3.3 Energy & Material Optimization: Cutting Costs Sustainably
Battery production is energy- and material-intensive—optimizing these areas delivers both cost and environmental benefits.
- Energy Efficiency: Retrofit coaters with heat recovery systems (capturing waste heat from drying zones to preheat incoming air), reducing energy consumption by 30-40%. A 5GWh line using this technology saves ~10,000 MWh annually (equivalent to $1.2M at $0.12/kWh).
- Material Utilization: Use AI-powered slitting machines to optimize electrode cutting patterns, reducing scrap from 8% to 3%. For a 10GWh line, this saves ~500 tons of cathode material annually ($5M at $10/kg).
- Water Conservation: Implement closed-loop water systems for electrode washing, reducing water use by 60-70%. LG Energy Solution’s Ochang factory uses this setup, cutting water consumption from 8,000 m³/day to 3,000 m³/day.
3.4 Quality Traceability: Meeting Regulatory & Customer Requirements
Global standards (e.g., IEC 62133 for battery safety) and customer demands (e.g., automakers requiring full traceability) mandate robust data tracking.
- Data Integration: Connect equipment to an MES (Manufacturing Execution System) via OPC UA protocol, capturing 100+ parameters per cell (e.g., coating thickness, welding power, formation voltage). This data should be stored for ≥10 years (per EU battery regulations).
- Blockchain for Traceability: For high-value applications (e.g., EV batteries), use blockchain to create immutable records. Volkswagen’s battery division uses a blockchain platform to trace cells from raw materials to packs, enabling customers to verify origin and performance.
Chapter 4: Anticipating the Future—Future-Proofing Equipment for Next-Generation Technologies
The battery industry is evolving rapidly—SSBs, intelligent factories, and globalization will reshape equipment needs. Manufacturers must plan today to avoid obsolescence.
4.1 Equipment Innovations for Solid-State Batteries
SSBs offer higher energy density (≥400 Wh/kg vs. 300 Wh/kg for LiBs) and improved safety, but they require a complete equipment overhaul. Key innovations include:
- Dry Electrode Coaters: Replace wet coating (which uses toxic solvents) with dry processes like electrostatic spraying or compression molding. Hohsen’s dry coater can process sulfur-based cathodes at 150°C, achieving a electrode density of 3.5 g/cm³ (vs. 3.0 g/cm³ for wet coating).
- Isostatic Presses: Apply uniform pressure (100-200 MPa) to SSB cells to ensure solid electrolyte-electrode contact. Kobe Steel’s isostatic press has a pressure control precision of ±1 MPa, reducing cell resistance variation by 25%.
- Vacuum Encapsulation Machines: SSBs are sensitive to moisture and oxygen, requiring encapsulation in ultra-high vacuum (≤1×10⁻⁶ Pa). Manz’s vacuum encapsulator achieves this, extending SSB cycle life by 300%.
Market Timeline: SSB equipment will enter mass production by 2027-2028, with early adopters (e.g., Toyota, QuantumScape) investing $500M-$1B in pilot lines. Manufacturers should allocate 10-15% of equipment budgets to R&D partnerships with SSB equipment vendors.
4.2 The Rise of Intelligent Factories: AI & Digital Twins
Intelligent manufacturing will transform how equipment is used and managed. Two key technologies are:
- Digital Twins: Create virtual replicas of equipment lines to simulate process changes. For example, CATL uses a digital twin of its coating line to test new LFP slurry formulations, reducing physical trial time by 50% and material waste by 40%.
- AI-Powered Process Optimization: Use machine learning to adjust equipment parameters in real time. A Chinese manufacturer’s AI system optimizes coater speed and temperature based on slurry viscosity, increasing throughput by 12% while maintaining precision.
Implementation Path: Start small—pilot a digital twin for one process (e.g., coating) before scaling to the entire line. Budget $500,000-$1M for AI/MES integration per GWh of capacity.
4.3 Globalization of Domestic Equipment: Opportunities & Challenges
Chinese and Korean equipment vendors are expanding globally, challenging Japanese and German dominance. Key trends include:
- Localization: Vendors like Wuxi Lead are building factories in Europe and the U.S. to meet IRA and EU localization requirements. Wuxi Lead’s German facility (opening 2025) will produce coaters with 80% European-sourced components.
- Import Substitution: Domestic vendors are closing the gap in core components—e.g., Chinese sensor maker Sensirion now supplies 30% of the global battery equipment sensor market (vs. 5% in 2018).
- Challenges: Intellectual property disputes remain a risk—e.g., in 2023, Kobe Steel sued a Chinese vendor for patent infringement on isostatic press designs. Manufacturers should conduct thorough IP due diligence before purchasing.
Conclusion
Battery production equipment lines are more than just machinery—they are strategic assets that determine a manufacturer’s competitiveness in a fast-growing market. From understanding the nuances of electrode coating to investing in SSB-ready equipment, every decision impacts yield, cost, and long-term viability.
The key takeaways for manufacturers are:
- 1. Align Equipment with Chemistry: Choose machines tailored to your battery type (e.g., dry coaters for SSBs, high-precision presses for NCM).
- 2. Balance Performance and Cost: Use domestic equipment for mature processes and imported equipment for advanced applications, or adopt hybrid setups.
- 3. Optimize Operations with Data: Leverage IoT and AI for predictive maintenance and process optimization, reducing downtime and costs.
- 4. Plan for the Future: Allocate budgets to SSB equipment R&D and intelligent manufacturing, avoiding obsolescence as technologies evolve.
As the battery industry moves toward higher energy density, lower costs, and greater sustainability, equipment lines will remain the backbone of progress. By following the frameworks outlined in this guide, manufacturers can navigate challenges, seize opportunities, and build a resilient, future-ready production ecosystem.
Tags: Battery Production Equipment, Solid-State Battery, Lithium-Ion Battery, Manufacturing Optimization, Predictive Maintenance
Category: Battery Technology, Manufacturing Guide